


Retail Best Practices: Finding the Impact of Seasonal Sales
Overview
With fall upon us, the weather is getting cooler. The effects of the changing seasons can be felt in the world around us, and in unit sales, too. In fact, seasonal effects have an impact on almost most every Consumer Packaged Goods (CPG) company. Even without a distinct selling season, consumer products are often impacted by foot traffic patterns from the time of year or holidays. Given that, it’s important – and also challenging – to have items stocked with the proper inventory levels in-store and on-time. A busy season can make or break a business. Too much supply can result in large expenses such as buybacks. Too little supply can create out-of-stock issues and result in massive lost sales and unhappy shoppers.
These season challenges lead to the question: When is the best time to start managing seasonal inventory flow? And how do you go about managing it?
Best Practices
Based on its work with top CPG’s to address these and other challenges, RSi has developed the following best practices:
- Track inventory measures well before the season begins and closely throughout. For example, a Fortune 500 CPG company working with RSi needed to provide product shipment recommendations to the retailer seven months prior to a major holiday. Therefore, planning efforts for managing seasonal inventory flow began almost a year prior to the major holiday. By building reports to project inventory flow from the DC to the store, the CPG company was able to forecast accurately, minimize buyback, and significantly reduce costs.
- Develop a continual planning cycle with integrated results-based adjustments for optimal results. Executing and optimizing high sales seasons is a year-round job. Working with retailer stakeholders immediately after the prior busy season’s results are finalized can help to optimize your rolling 12-month inventory plan.
- Incorporate seasonality phases into your inventory planning cycle. Your inventory planning has distinct steps, depending on the time of year. These steps are illustrated below in the Seasonal Planning Cycle diagram.
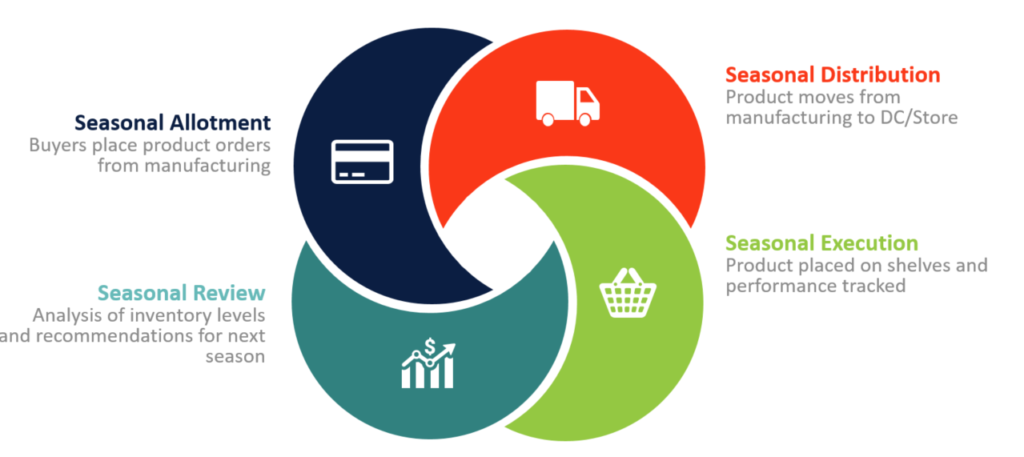
Seasonal Planning Cycle
Each of these steps is important and requires different data. However, the use of a template, such as the Seasonal Allocation Growth Driver, can simplify the analysis of the data points both individually and in conjunction.
A Brief Example on How to Find Seasonality’s Impact
There are a myriad of ways to measure seasonal effects on inventory levels. One of the most efficient is to review weekly sales over a 52-week rolling period. The comparison of each week’s sales to the annual total is a quick way to look at sales and determine peak selling season.
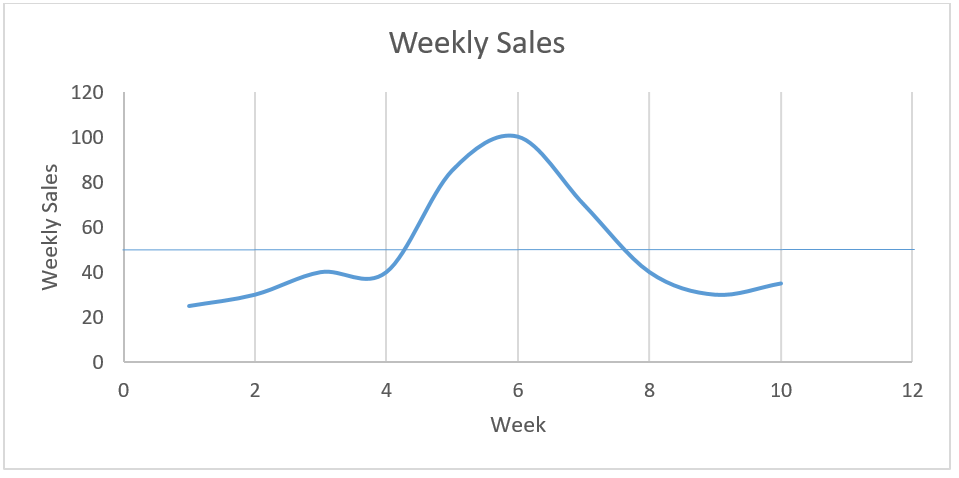
For example, if a fictional product generated $100k in total annual sales in the previous year, the following chart depicts the weeks most likely impacted by seasonal changes.
These results suggest that inventory levels in Weeks 2 and 3 should be reviewed and make sure they take into account any holidays, weather changes, and/or increased sales in a complementary product.
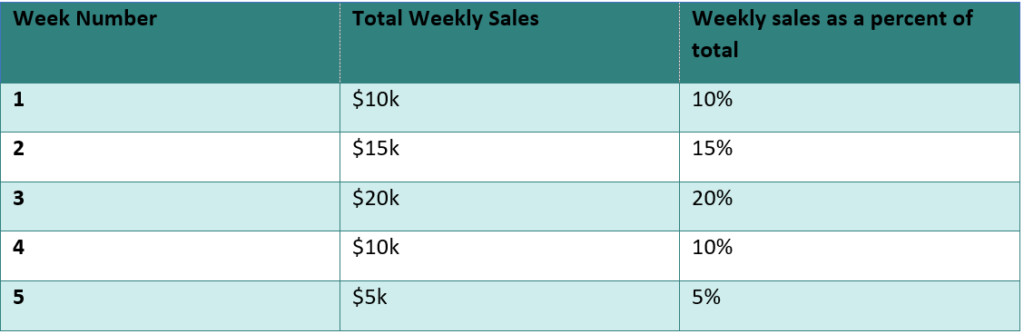
Another way to compare sales and measure the effects of seasonal change is looking at the average sales in units, otherwise known as the index level. Since most years are 52 weeks, any sales that are above 1/52 (1.9%) of total annual sales should be considered over-indexed. In peak seasonal weeks, the percent of total sales volume units tends to be greater than 2.5%. This, of course, will vary by product and industry but can work as a back-of-the-napkin calculation.
Illustrated in the chart below, the total sales of the product are $500 over 10 weeks. Therefore, the index level is 1/10 or $50. The sales in weeks 4-8 are over-indexed. Weeks 5-7 have index levels above 2.5% and therefore may be considered peak seasonal weeks.
Are You Ready to Rule the Shelf?
RSi has a wide range of solutions to help you understand, track and optimize your seasonal opportunities. Our Essential Growth Drivers help to arm CPG manufacturers with the tools they need to maximize product performance throughout every stage of the product lifecycle, increasing overall sales and profitability. If you need to expand your analytical resources and accelerate your results, you can also tap into RSi’s expert resources on-demand with Professional Services. RSi Data Scientists will create, automate and optimize the performance of your mission-critical reports, dashboards and analytical tools with custom report creation. Learn more about how to get free custom report creation here.
Leave a Reply
You must be logged in to post a comment.